Chrome DevTools Performance Panel: Analyze Your Website's Performance
The Performance panel in Chrome DevTools allows you to record and analyze CPU performance profiles of your web applications. Use it to identify performance bottlenecks and optimize resource usage.
Key Features of the Performance Panel
- Record a performance profile.
- Adjust capture settings.
- Analyze performance reports.
Opening the Performance Panel
To open the Performance panel, launch DevTools and select the Performance tab.
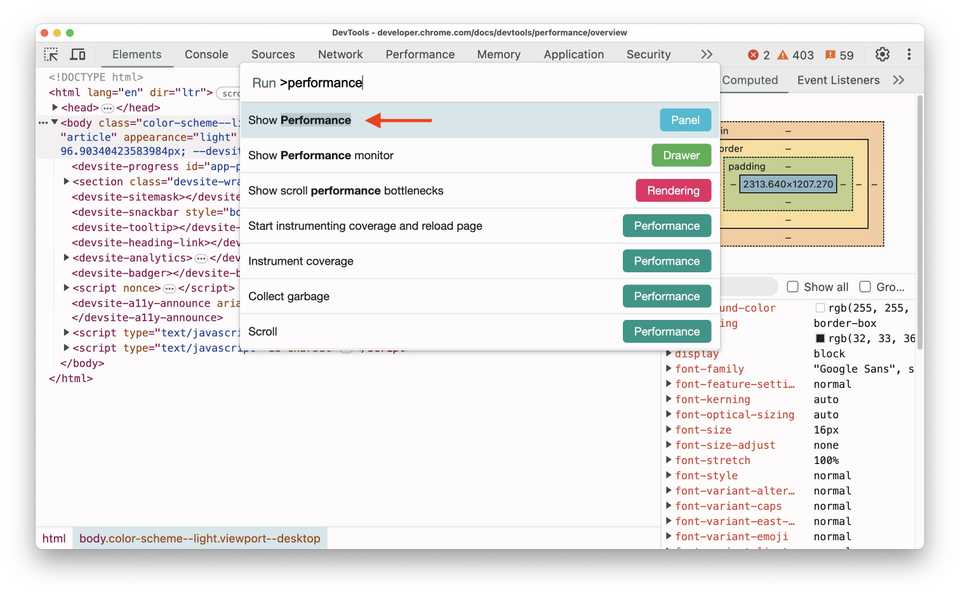
Alternatively, you can use the Command menu:
- Open DevTools.
- Open the Command menu:
- macOS: Command+Shift+P
- Windows, Linux, ChromeOS: Control+Shift+P
- Type
Performance, selectShow Performance panel, and press Enter.
Monitoring Core Web Vitals Live
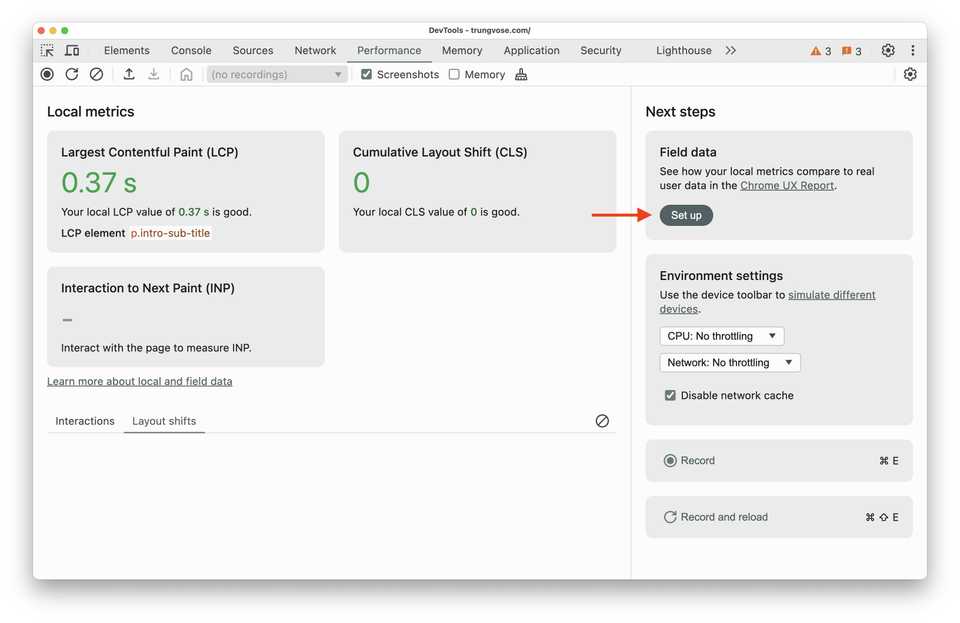
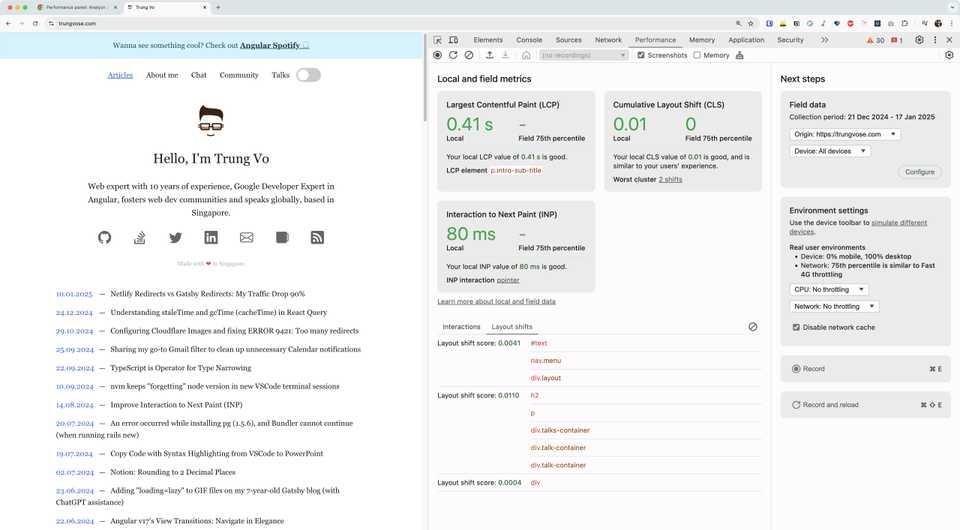
Upon opening the Performance panel, it immediately displays your local Largest Contentful Paint (LCP) and Cumulative Layout Shift (CLS) metrics, along with their scores (good, needs improvement, or bad).
Interacting with your page also captures your local Interaction to Next Paint (INP) score, providing a comprehensive overview of your page’s Core Web Vitals.
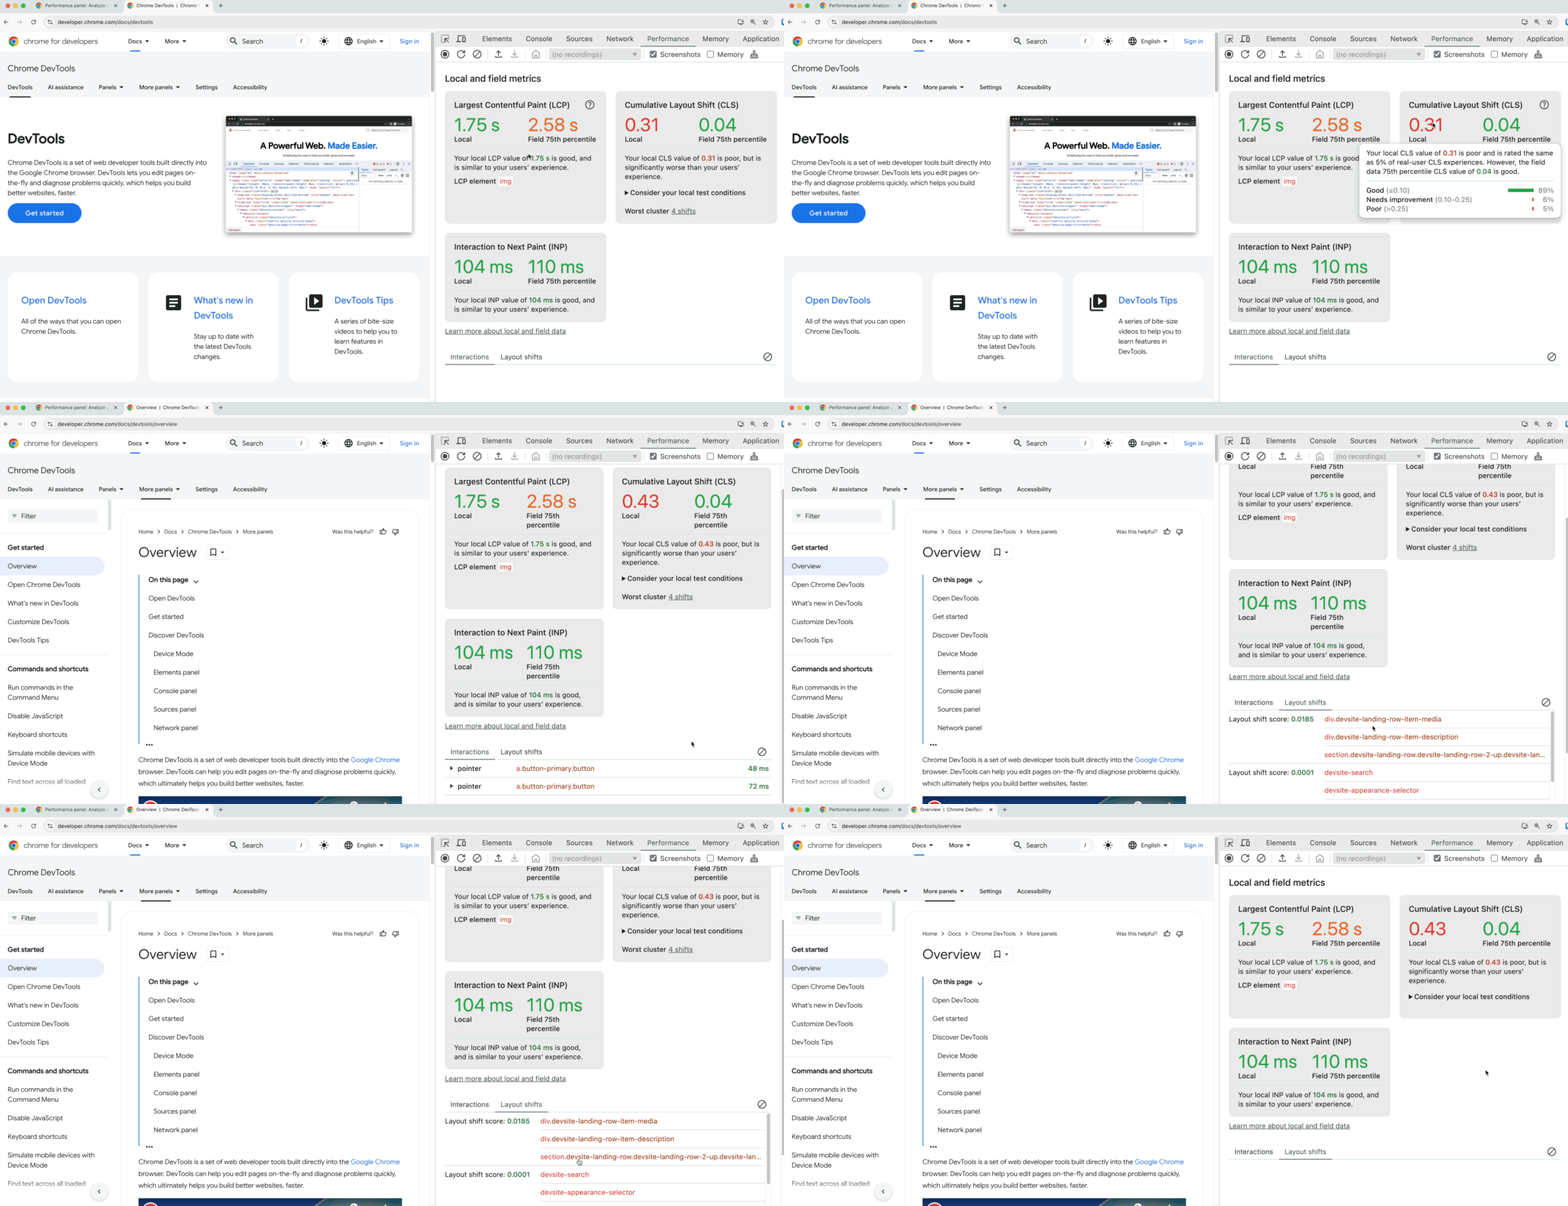
Under the Interactions and Layout shifts tabs, you can find detailed tables of captured interactions and layout shifts, including elements, timings, phases (for interactions), and scores (for layout shifts). To clear these lists, click Clear.
Comparing Local Metrics with User Experience
You can fetch field data from the Chrome UX Report to compare your site’s user experience with your local metrics.
To add field data:
- In Performance > Next steps > Field data, click Set up.
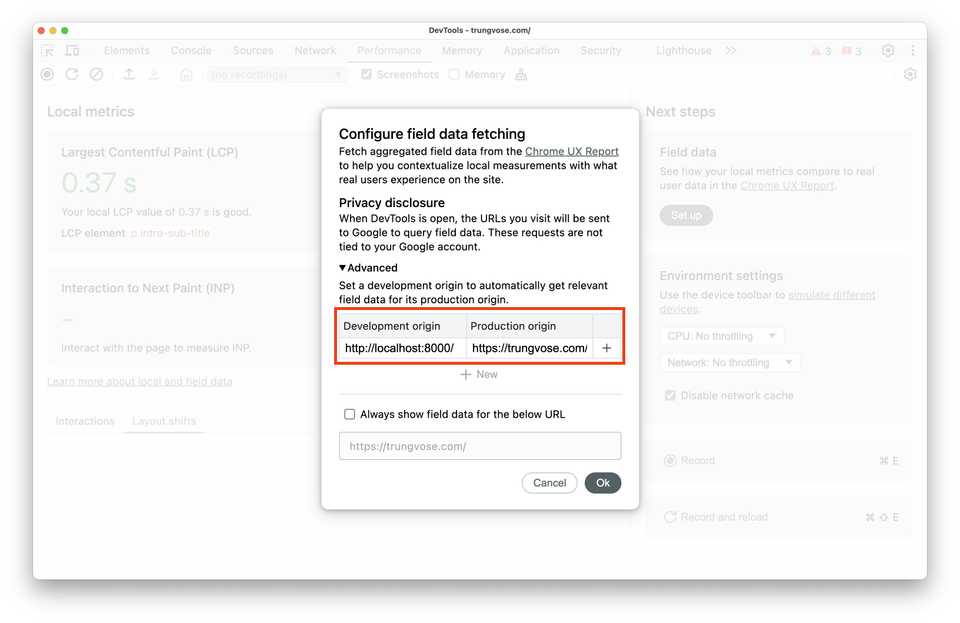
- In the Configure field data fetching dialog, review the Privacy disclosure, and click Ok.
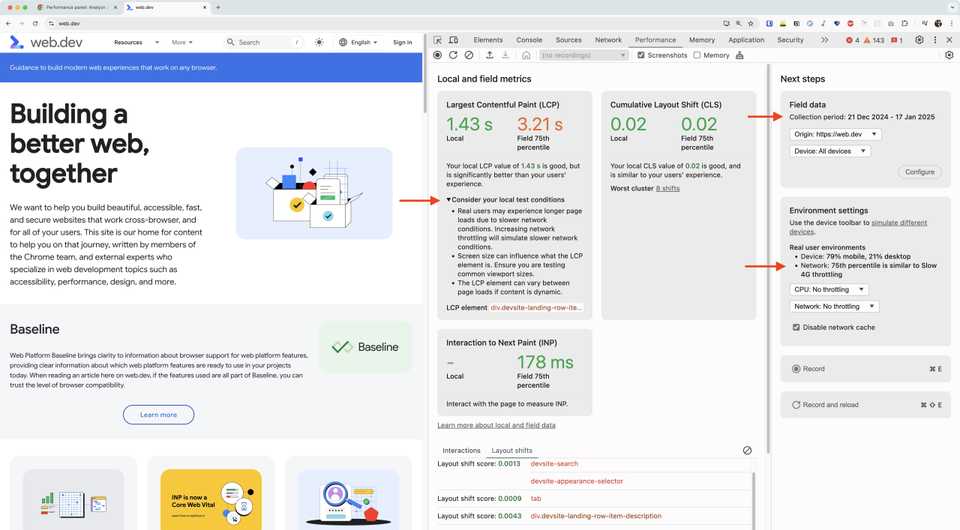
With field data fetching enabled, the Performance panel compares your local metric scores with those experienced by your users. The collection period is displayed in the Field data section on the right.
If your website data is not fully available in the Chrome UX Report, you might see limited metrics, such as a CLS score of 0.
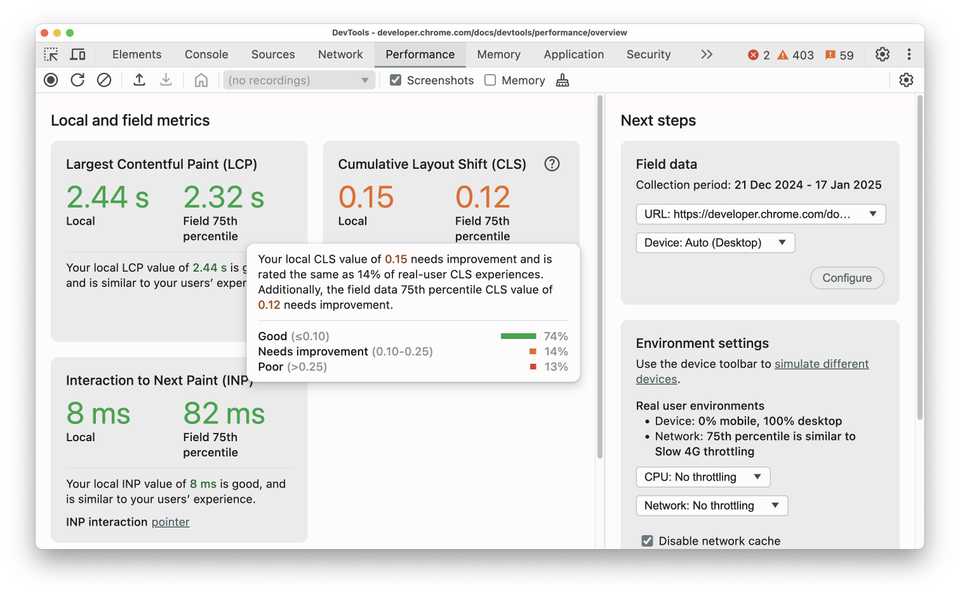
For other sites like web.dev, you can see a detailed comparison between local metrics and field data:
Configuring Your Environment to Match User Conditions
- Expand the Consider your local test conditions section.
Typical user environments:
- Device: 79% mobile, 21% desktop
- Network: 75th percentile similar to Slow 4G throttling
-
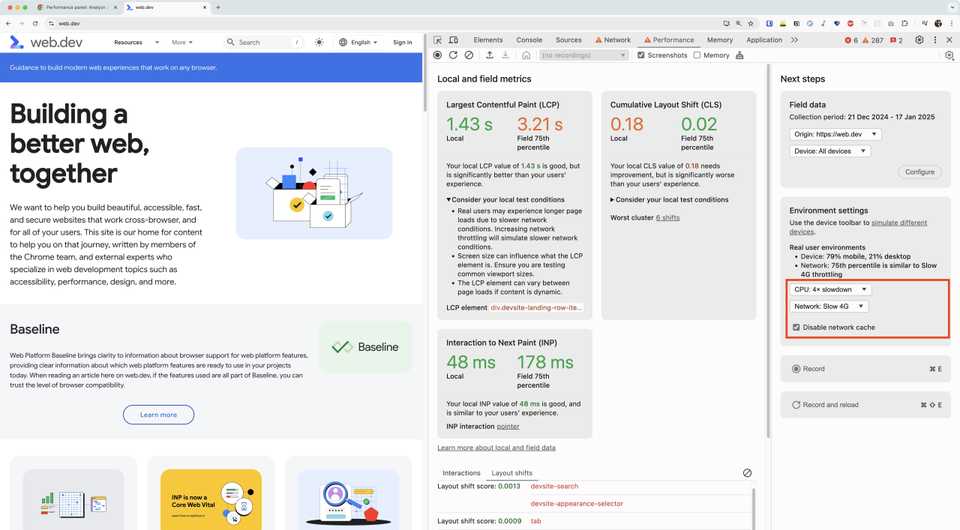
In the Environment settings section, set the Network drop-down to Slow 4G.
-
Reload the page, interact with it to capture your local INP, and compare the metric scores again.
Improving Core Web Vitals
Start optimizing your website’s Core Web Vitals:
- Optimize Largest Contentful Paint (LCP)
- Optimize Cumulative Layout Shift (CLS)
- Optimize Interaction to Next Paint (INP)
