Core Web Vitals
As I mentioned on the previous two articles, Why Web Performance Matters: An Introduction and Perceived Performance, web performance is crucial for user experience and business success. In this article, we’ll explore how to measure web performance using Core Web Vitals.
Shout-out to Web Performance Fundamentals for providing a comprehensive guide on web performance.
Page Load Time
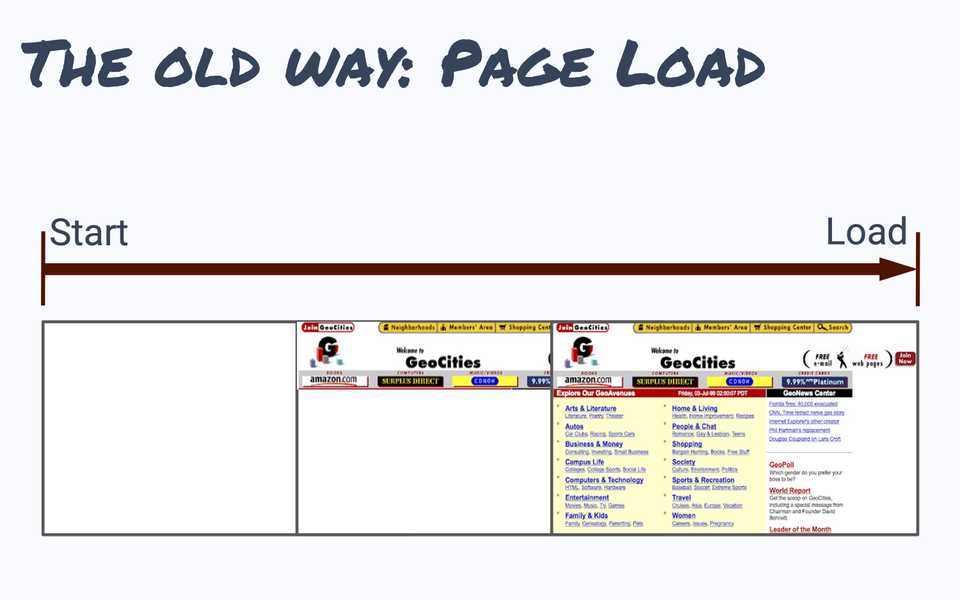
In the beginning, there was PageLoad. Website performance was measured with a single measurement of the time until the PageLoad event is fired.
But PageLoad doesn’t fully describe performance. Some sites initially load really fast, but dynamic content needs to load. PageLoad doesn’t fully capture whether a website feels fast.
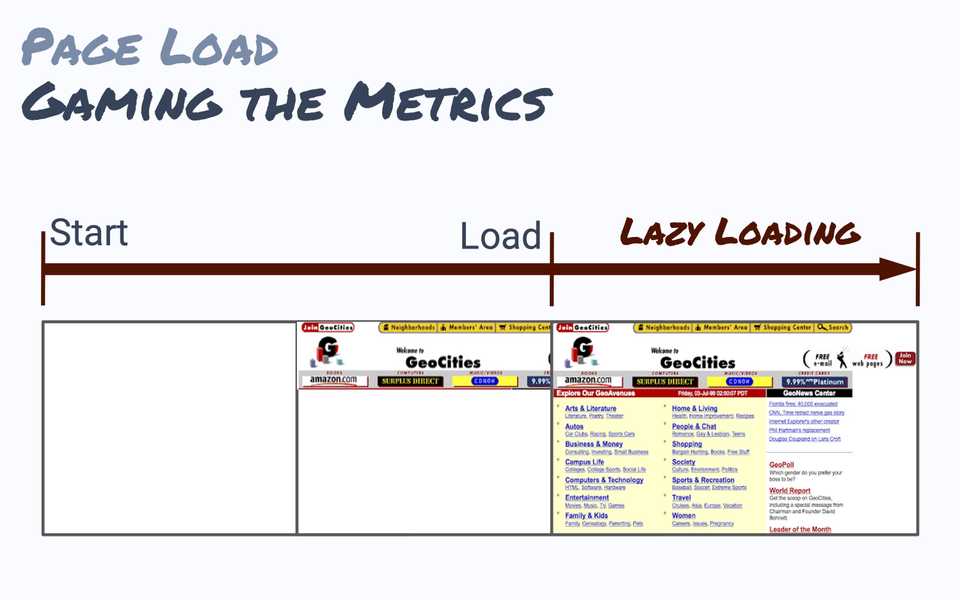
Worse, PageLoad was easy to manipulate. Developers could improve their PageLoad time by deferring work with JavaScript. Lazy-loading, async script loaders, client-side rendering, and dynamic content were all patterns that often improved PageLoad time, but created a slower experience from the end user perspective.
What do we do instead?
There are lots of ways a website can feel slow: slow to start, slow to finish, jumping around, slow to respond, and more. We can’t use one metric to understand performance anymore.
Core Web Vitals
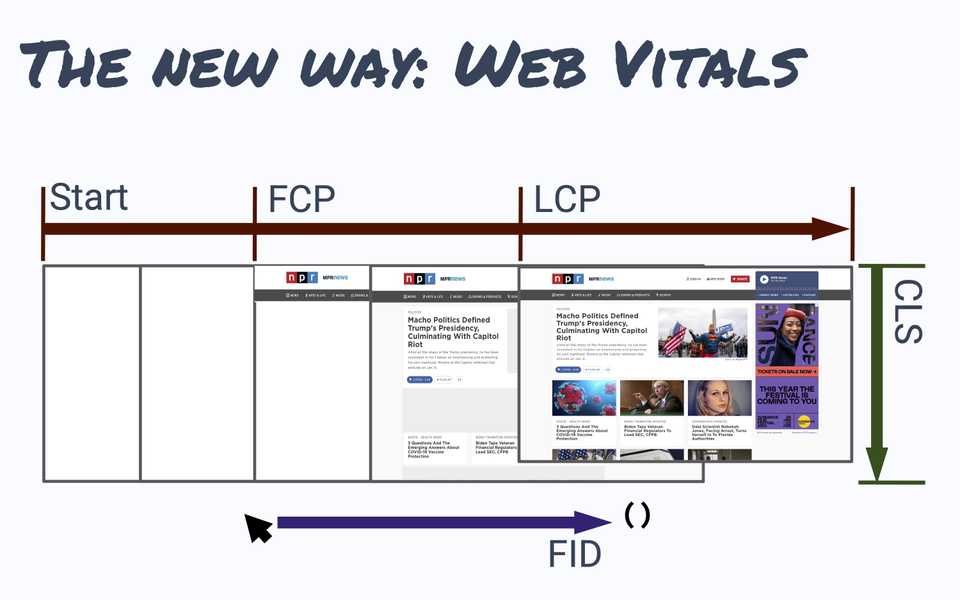
In 2019, Google introduced a set of metrics intent on measuring the actual performance of a website as the users would see it. These metrics are collectively called the Core Web Vitals.
They are measured in all Chrome-based browsers, including the Googlebot spider, which uses these scores to influence page rank.
Note that Chrome-based browsers, Firefox, and Safari support these metrics and compatibility is increasing. You can check the current compatibility of the Core Web Vitals here.
The web-vitals code has been tested and will run without error in all major browsers as well as Internet Explorer back to version 9. However, some of the APIs required to capture these metrics are currently only available in Chromium-based browsers (e.g. Chrome, Edge, Opera, Samsung Internet).
Browser support for each function is as follows:
- onCLS(): Chromium
- onFCP(): Chromium, Firefox, Safari
- onFID(): Chromium, Firefox (Deprecated)
- onINP(): Chromium
- onLCP(): Chromium, Firefox
- onTTFB(): Chromium, Firefox, Safari
The metrics that make up Core Web Vitals will evolve over time. The current set focuses on three aspects of the user experience—loading, interactivity, and visual stability—and includes the following metrics (and their respective thresholds):
-
Largest Contentful Paint (LCP): measures loading performance. To provide a good user experience, LCP should occur within
2.5seconds of when the page first starts loading. -
Interaction to Next Paint (INP): measures interactivity. To provide a good user experience, pages should have a INP of
200milliseconds or less. -
Cumulative Layout Shift (CLS): measures visual stability. To provide a good user experience, pages should maintain a CLS of
0.1. or less.
You might have heard of First Input Delay (FID), however it is deprecated September 9 2024 in favor of Interaction to Next Paint (INP).
While First Contentful Paint (FCP) is not one of the Core Web Vitals that impact Google rankings, it is still one of Google’s broader set of Web Vitals metrics. The Largest Contentful Paint (LCP) is one of the Core Web Vitals metrics, and it can never be lower than the First Contentful Paint (FCP).
Largest Contentful Paint (LCP)
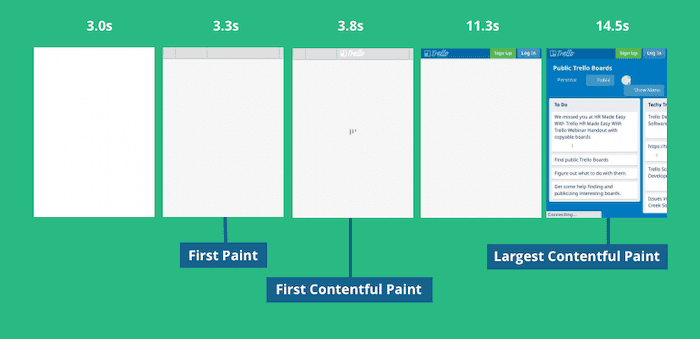
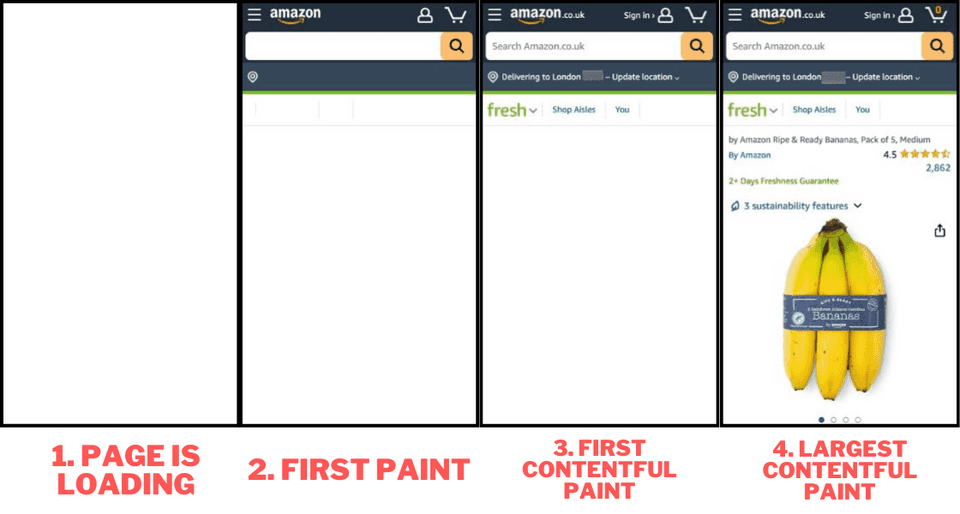
“Largest Contentful Paint” measures how long it takes until the browser renders the largest amount of content to the screen. At this point, ideally, the user can see the content they are looking for and believes the page is nearly done.
Like the First Paint and First Contentful Paint metrics, LCP is a paint timing metric that marks a rendering milestone in the page load process.
Contentful means that content like text or an image were rendered, rather than just showing empty boxes or background images.
In the website filmstrip above the LCP element is a piece of text, but it’s also common for the LCP to be caused by an image like in the example below.
Another example, navigating to the homepage of NPR News has a few different renders, but this is the largest one by pixel area:
The advertisement is probably not what the user is looking for, but the article images might be.
LCP encourages websites to finish quickly by emphasizing their primary content and making sure it loads fast.
For optimal user experience and search engine performance, websites should aim for an LCP of
2.5seconds or less. Google considers an LCP of4seconds or more to be poor, which can worsen your search rankings and user experience.
Cumulative Layout Shift (CLS)
“Cumulative Layout Shift” is a little harder to understand because it does not measure time. CLS measures how much the content on a page moves around as other content is loaded and rendered. Like this:
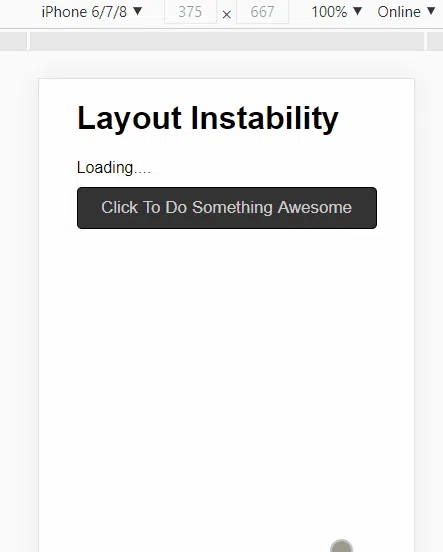
Layout Shifts measure how late-rendered content affects the user experience of a page. Layout shifts that push important content around are really frustrating to use.
CLS discourages websites from moving content around once the user sees it and minimizing the amount of late-rendered content.
Layout shift score
To provide a good user experience, sites should strive to have a CLS score of
0.1or less
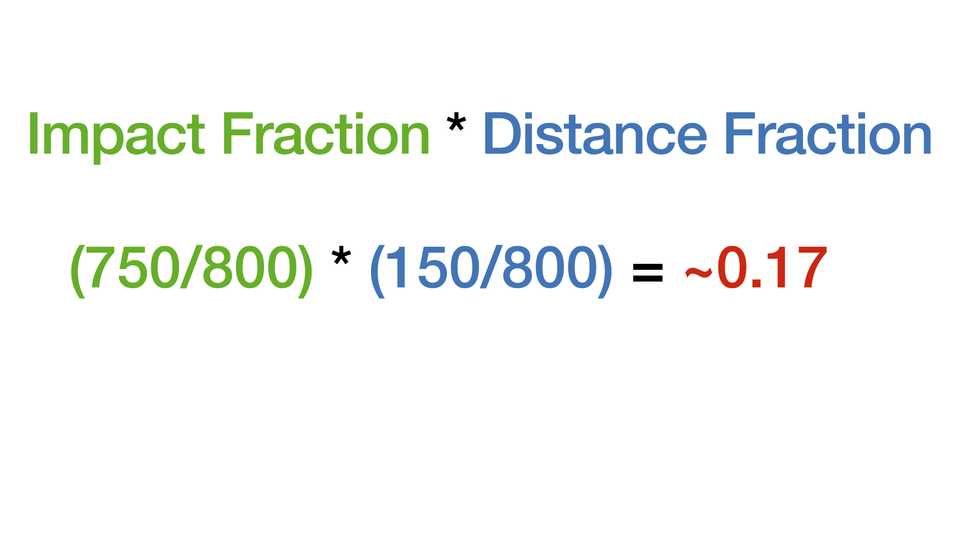
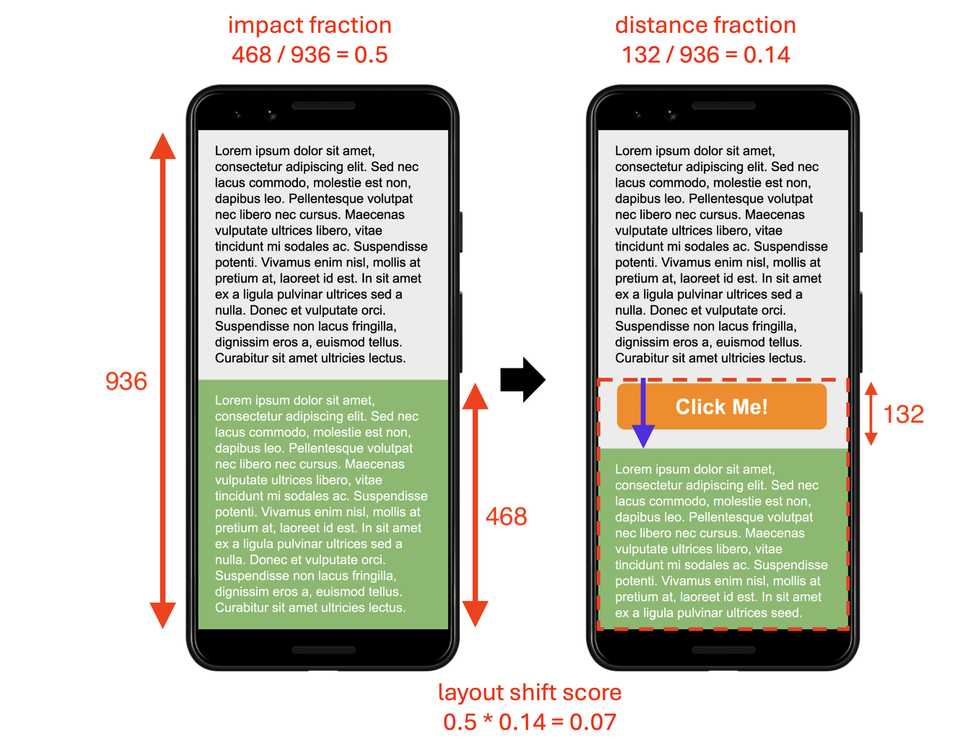
To calculate the layout shift score, the browser looks at the viewport size and the movement of unstable elements in the viewport between two rendered frames. The layout shift score is a product of two measures of that movement: the impact fraction and the distance fraction (both defined below).
layout shift score = impact fraction * distance fraction- impact fraction: the area of the viewport affected by the layout shift (impact size / viewport size)
- distance fraction: the distance the unstable element moved in the viewport (distance / viewport size)
See the example below:
Another example is the layout shift score for a mobile view:
Interaction to Next Paint (INP)
Interaction to Next Paint (INP) is a web performance metric that measures user interface responsiveness – how quickly a website responds to user interactions like clicks or key presses.
Specifically, it measures how much time elapses between a user interaction like a click or key press and the next time the user sees a visual update on the page.
How is Interaction to Next Paint measured?
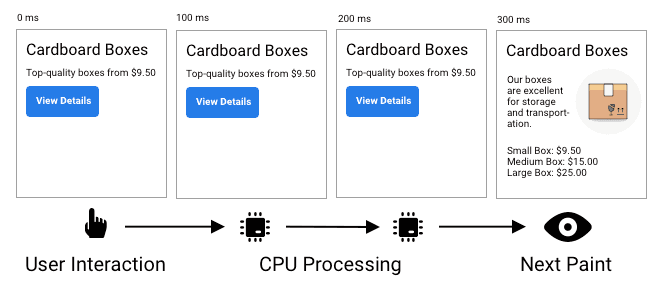
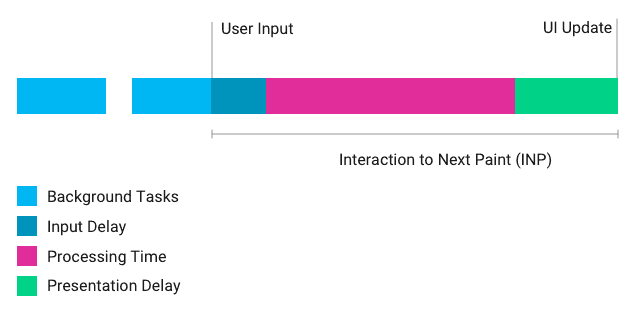
INP measures the responsiveness of your website by tracking the time between user input and UI updates. This metric consists of three key components:
- Input Delay: waiting for background tasks on the page that prevent the event handler from running
- Processing Time: running event handlers in JavaScript
- Presentation Delay: handling other queued up interactions, recalculating the page layout, and painting page content
This diagram shows an example timeline of different CPU tasks, and how they add up to INP activity. Interaction to Next Paint spans the entire time frame from the mouse, touch, or keyboard input up to the point when the next frame is rendered by the browser.
Summary
| Metric | Description | Good Score Threshold |
|---|---|---|
| Largest Contentful Paint (LCP) | How fast the main content loads. | ≤ 2.5 seconds |
| Cumulative Layout Shift (CLS) | How stable the page layout is. | ≤ 0.1 |
| Interaction to Next Paint (INP) | How quickly the page responds to user actions. | ≤ 200 milliseconds |
These metrics help ensure a good user experience by focusing on loading speed, visual stability, and responsiveness.
