Improve Interaction to Next Paint (INP)
Imagine you’re at a restaurant. You place your order, and the waiter immediately acknowledges it with a nod or a smile. This quick response reassures you that your order is being processed. Now, think about a situation where the waiter ignores you for a while before acknowledging your order. You might feel frustrated or think that your order wasn’t taken. This is similar to how web pages should respond to user interactions.
Understanding INP
Chrome usage data shows that 90% of a user’s time on a page is spent after it loads. Thus, careful measurement of responsiveness throughout the page lifecycle is important. This is what the INP metric assesses.
Good responsiveness means that a page responds quickly to interactions. When a page responds to an interaction, the browser presents visual feedback in the next frame that it paints. Visual feedback tells you if, for example, an item you add to an online shopping cart is indeed being added, whether a mobile navigation menu has opened, if a login form’s contents are being authenticated by the server, and so forth.
Some interactions naturally take longer than others, but for especially complex interactions, it’s important to quickly present some initial visual feedback to tell the user that something is happening. The next frame that the browser will paint is the earliest opportunity to do this.
Therefore, the intent of INP is not to measure all the eventual effects of an interaction—such as network fetches and UI updates from other asynchronous operations—but the time that the next paint is being blocked. By delaying visual feedback, users may get the impression that the page is not responding quickly enough, and INP was developed to help developers measure this part of the user experience.
In the following video, the example on the right gives immediate visual feedback that an accordion is opening. Poor responsiveness is demonstrated in the example on the left, and how it can create poor user experiences.

An example of poor versus good responsiveness. On the left, long tasks block the accordion from opening. This causes the user to click multiple times, thinking the experience is broken. When the main thread catches up, it processes the delayed inputs, resulting in the accordion opening and closing unexpectedly. On the right, a more responsive page opens the accordion quickly and without incident.
First Input Delay (FID)
As of March 2024, Interaction to Next Paint (INP) will replace the First Input Delay (FID) as a new Core Web Vital.
First Input Delay is a web performance metric that measures the time between a user’s very first interaction with a web page and the time when the browser’s main thread is able to start processing that interaction event.
When a user interacts with a web page, an event is added to a queue to be processed by the browser’s main thread. However, if the main thread is already busy doing other tasks like parsing HTML, executing JavaScript, or handling other event listeners, the new event has to wait in the queue.
The FID metric captures the duration of this waiting time, which tells us how long it takes for the browser to respond to the user’s first input while the main thread is busy.
However, the First Input Delay (FID) metric has some shortcomings:
- FID only considers the delay of the first input event, ignoring subsequent interactions that may also be slow or even slower.
- Other factors can contribute to a longer visual feedback delay between user interactions, which FID doesn’t measure. This includes the time it takes to process event handlers and recalculate the layout before providing visual feedback to the user.
Interaction to Next Paint (INP)
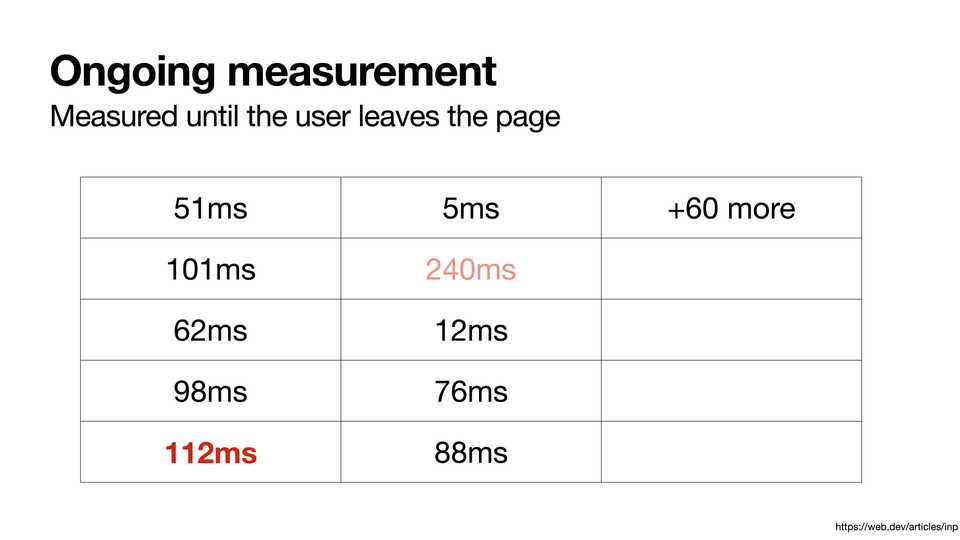
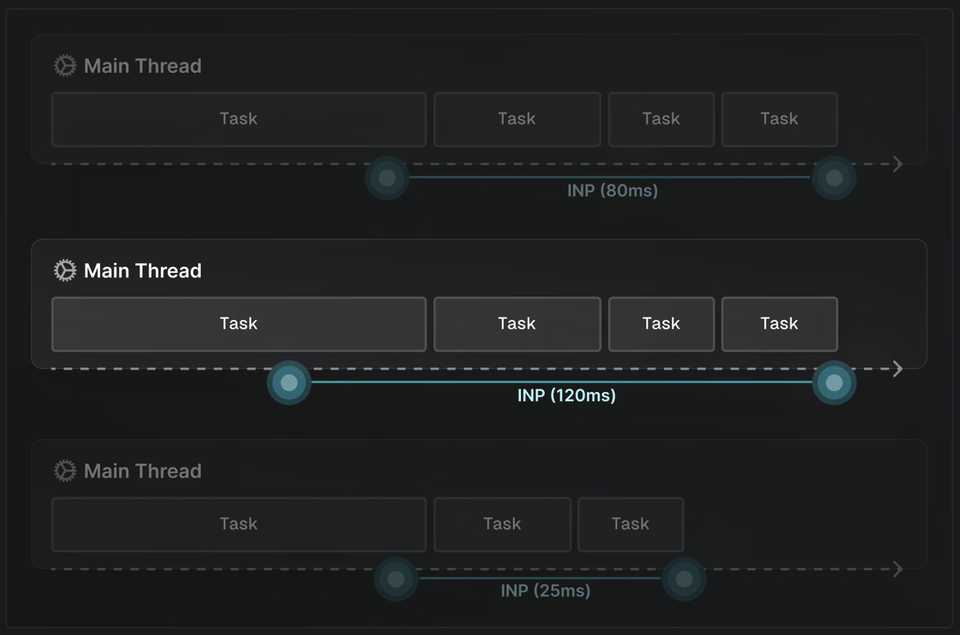
To address these limitations, the Interaction to Next Paint (INP) metric will replace First Input Delay. INP is a metric that assesses a page’s overall responsiveness to user interactions by observing the latency of all click, tap, and keyboard interactions that occur throughout the lifespan of a user’s visit to a page. The final INP value is the longest interaction observed, ignoring outliers.
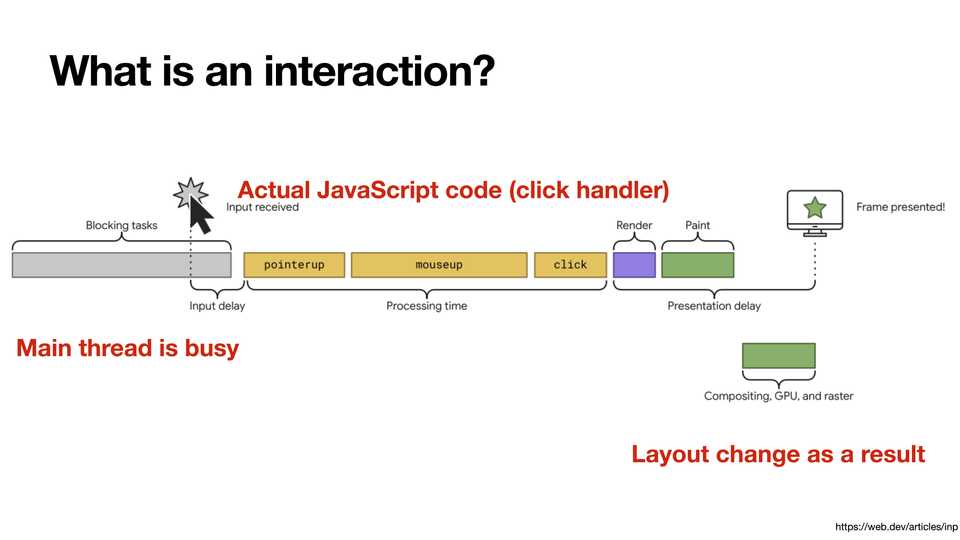
While FID only measured the input delay, which is the time between user input and the browser starting to execute the event handler, INP measures:
- Input Delay: the time between user interaction and the time the browser is able to process the event, similar to FID.
- Processing Delay: the time it takes the browser to process the event handlers.
- Presentational Delay: the time it takes the browser to recalculate the layout and paint the pixels to the screen.
Additionally, whereas FID only measured the very first user interaction, the INP score is measured when the user leaves the page by aggregating all interactions the user made with the page throughout the page’s lifetime and returning the worst-measured score.
With INP, we no longer have to focus solely on optimizing event queuing times and main thread availability, as was the case with FID. Now, it is also crucial to address the entire lifecycle of a user interaction. This includes processing event handlers, recalculating layouts, and painting updates to the screen, all of which are critical components of the INP metric.
What is a good INP score?
Pinning labels such as “good” or “poor” on a responsiveness metric is difficult. On one hand, you want to encourage development practices that prioritize good responsiveness. On the other hand, you must account for the fact that there’s considerable variability in the capabilities of devices people use to set achievable development expectations.
To ensure you’re delivering user experiences with good responsiveness, a good threshold to measure is the 75th percentile of page loads recorded in the field, segmented across mobile and desktop devices:
- An INP below or at
200milliseconds means a page has good responsiveness. - An INP above
200milliseconds and below or at500milliseconds means a page’s responsiveness needs improvement. - An INP above
500milliseconds means a page has poor responsiveness.
What is an interaction?
For the purposes of INP, only the following interaction types are observed:
Clickingwith a mouse.Tappingon a device with a touchscreen.Pressinga key on either a physical or onscreen keyboard.
Interactions can consist of multiple events. For example, a keystroke includes the keydown, keypress, and keyup events. Tap interactions contain pointerup and pointerdown events. The event with the longest duration within the interaction is what contributes to the interaction’s total latency.
The most important: Avoiding long tasks
Common advice for keeping JavaScript apps fast tends to boil down to the following advice:
- “Don’t block the main thread.”
- “Break up your long tasks.”
This is great advice, but what work does it involve? Shipping less JavaScript is good, but does that automatically equate to more responsive user interfaces? Maybe, but maybe not.
To understand how to optimize tasks in JavaScript, you first need to know what tasks are, and how the browser handles them.
What is a task?
A task is any discrete piece of work that the browser does. That work includes rendering, parsing HTML and CSS, running JavaScript, and other types of work you may not have direct control over. Of all of this, the JavaScript you write is perhaps the largest source of tasks.
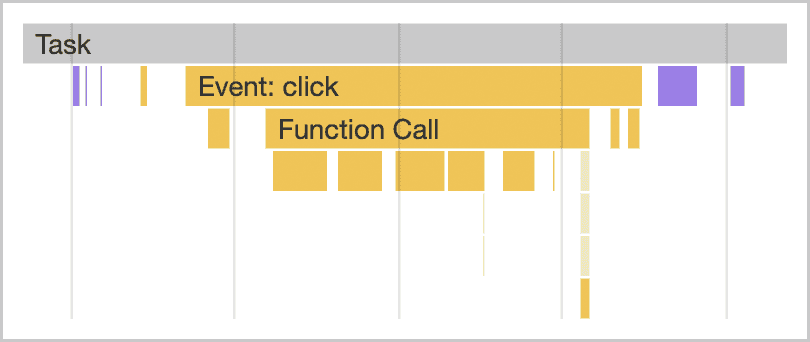 A task started by a click event handler in, shown in Chrome DevTools’ performance profiler.
Tasks associated with JavaScript impact performance in a couple of ways:
- When a browser downloads a JavaScript file during startup, it queues tasks to parse and compile that JavaScript so it can be executed later.
- At other times during the life of the page, tasks are queued when JavaScript does work such as responding to interactions through event handlers, JavaScript-driven animations, and background activity such as analytics collection.
All of this stuff—with the exception of web workers and similar APIs—happens on the main thread.
What is the main thread?
The main thread is where most tasks run in the browser, and where almost all JavaScript you write is executed.
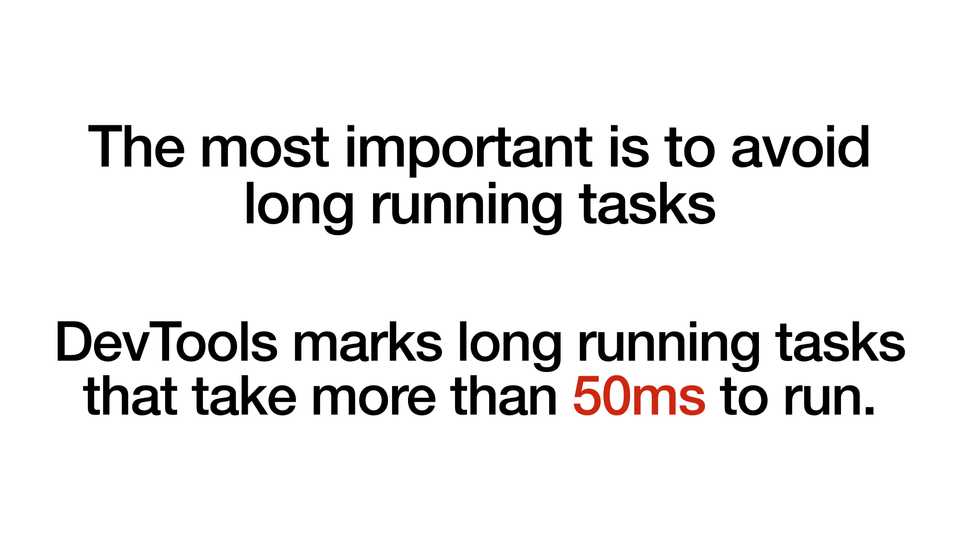
The main thread can only process one task at a time. Any task that takes longer than 50 milliseconds is a long task. For tasks that exceed 50 milliseconds, the task’s total time minus 50 milliseconds is known as the task’s blocking period.
 A long task as depicted in Chrome’s performance profiler. Long tasks are indicated by a red triangle in the corner of the task, with the blocking portion of the task filled in with a pattern of diagonal red stripes.
To prevent the main thread from being blocked for too long, you can break up a long task into several smaller ones.
 A visualization of a single long task versus that same task broken up into five shorter tasks.
Task management strategies
A common piece of advice in software architecture is to break up your work into smaller functions:
function saveSettings () {
  validateForm();
  showSpinner();
  saveToDatabase();
  updateUI();
  sendAnalytics();
}
In this example, there’s a function named saveSettings() that calls five functions to validate a form, show a spinner, send data to the application backend, update the user interface, and send analytics.
Conceptually, saveSettings() is well-architected. If you need to debug one of these functions, you can traverse the project tree to figure out what each function does. Breaking up work like this makes projects easier to navigate and maintain.
A potential problem here, though, is that JavaScript doesn’t run each of these functions as separate tasks because they are executed within the saveSettings() function. This means that all five functions will run as one task.
In the best case scenario, even just one of those functions can contribute 50 milliseconds or more to the task’s total length. In the worst case, more of those tasks can run much longer—especially on resource-constrained devices.
In this case, saveSettings() is triggered by a user click, and because the browser isn’t able to show a response until the entire function is finished running, the result of this long task is a slow and unresponsive UI, and will be measured as a poor Interaction to Next Paint (INP).
Manually defer code execution
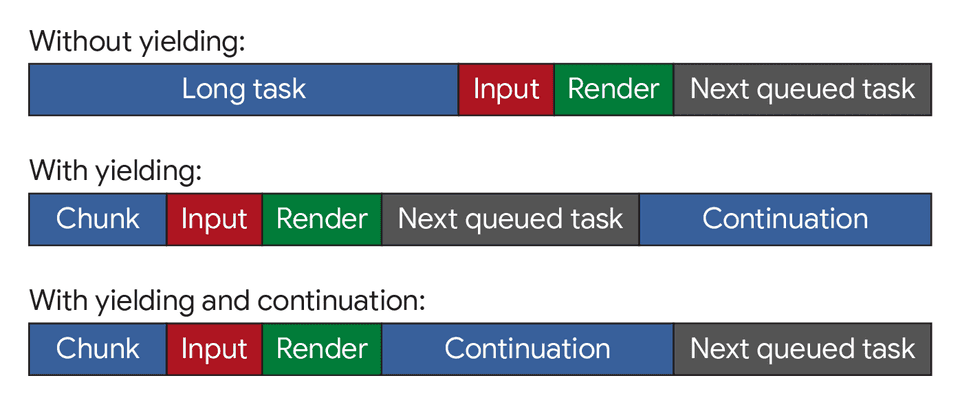
To make sure important user-facing tasks and UI responses happen before lower-priority tasks, you can yield to the main thread by briefly interrupting your work to give the browser opportunities to run more important tasks.
One method developers have used to break up tasks into smaller ones involves setTimeout(). With this technique, you pass the function to setTimeout(). This postpones execution of the callback into a separate task, even if you specify a timeout of 0.
function saveSettings () {
  // Do critical work that is user-visible:
  validateForm();
  showSpinner();
  updateUI();

  // Defer work that isn't user-visible to a separate task:
+  setTimeout(() => {
    saveToDatabase();
    sendAnalytics();
+  }, 0);
}
This is known as yielding, and it works best for a series of functions that need to run sequentially.
However, your code may not always be organized this way. For example, you could have a large amount of data that needs to be processed in a loop, and that task could take a very long time if there are many iterations.
function processData () {
  for (const item of largeDataArray) {
    // Process the individual item here.
  }
}
Using setTimeout() here is problematic because of developer ergonomics, and after five rounds of nested setTimeout()s, the browser will start imposing a minimum 4 millisecond delay for each additional setTimeout().
A dedicated yielding API: scheduler.yield()
scheduler.yield() is an API specifically designed for yielding to the main thread in the browser. Currently supported on Chrome 129.
It’s not language-level syntax or a special construct; scheduler.yield() is just a function that returns a Promise that will be resolved in a future task. Any code chained to run after that Promise is resolved (either in an explicit .then() chain or after awaiting it in an async function) will then run in that future task.
In practice: insert an await scheduler.yield() and the function will pause execution at that point and yield to the main thread. The execution of the rest of the function—called the continuation of the function—will be scheduled to run in a new event-loop task. When that task starts, the awaited promise will be resolved, and the function will continue executing where it left off.
async function saveSettings () {
  // Do critical work that is user-visible:
  validateForm();
  showSpinner();
  updateUI();

  // Yield to the main thread:
  await scheduler.yield()

  // Work that isn't user-visible, continued in a separate task:
  saveToDatabase();
  sendAnalytics();
}
The real benefit of scheduler.yield() over other yielding approaches, though, is that its continuation is prioritized, which means that if you yield in the middle of a task, the continuation of the current task will run before any other similar tasks are started.
This avoids code from other task sources from interrupting the order of your code’s execution, such as tasks from third-party scripts.
Cross-browser support
scheduler.yield() is not yet supported in all browsers, so a fallback is needed.
function yieldToMain () {
  if (globalThis.scheduler?.yield) {
    return scheduler.yield();
  }

  // Fall back to yielding with setTimeout.
  return new Promise(resolve => {
    setTimeout(resolve, 0);
  });
}
Conclusion
Managing tasks is challenging, but doing so ensures that your page responds more quickly to user interactions. There’s no one single piece of advice for managing and prioritizing tasks, but rather a number of different techniques. To reiterate, these are the main things you’ll want to consider when managing tasks:
- Yield to the main thread for critical, user-facing tasks.
- Use scheduler.yield() (with a cross-browser fallback) to ergonomically yield and get prioritized continuations

