Measuring Web Performance
Understanding how to measure web performance is crucial for ensuring a fast and efficient user experience. In this guide, we’ll explore various tools like Lighthouse, WebPageTest, and Chrome DevTools to help you measure web performance effectively.
Before diving into these tools, it’s important to understand the types of performance data you can collect. There are two main types: lab data and field data.
Lab Data and Field Data
Lab Data
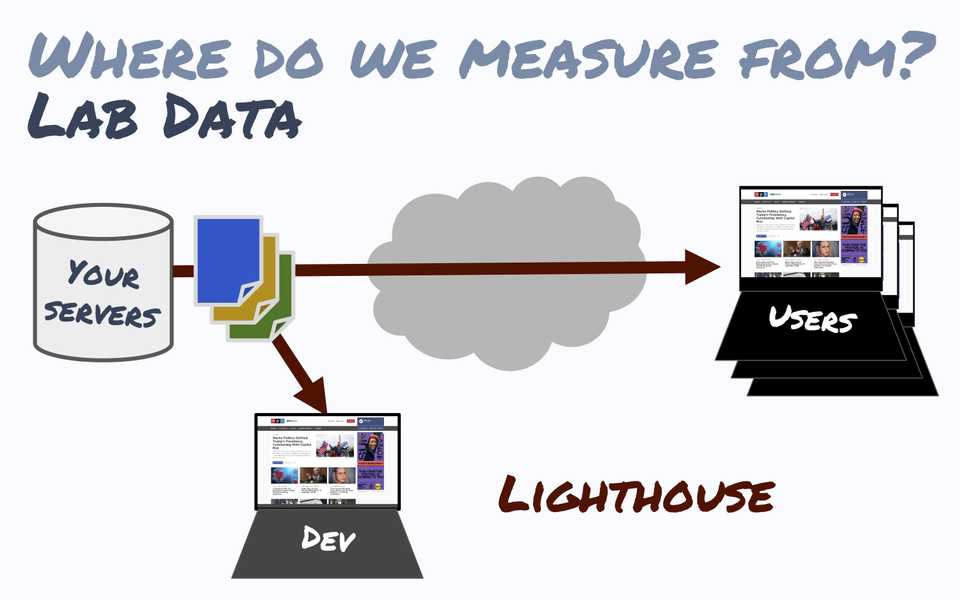
Lab data describes how hypothetical users may experience your website. This data is collected through controlled tests, such as those performed by Lighthouse. It represents a single webpage load from a specific location on the network.
Lab data is often referred to as “Synthetic Testing” because it measures performance from a known device and network. It provides an estimate of performance rather than actual user experience.
Field Data
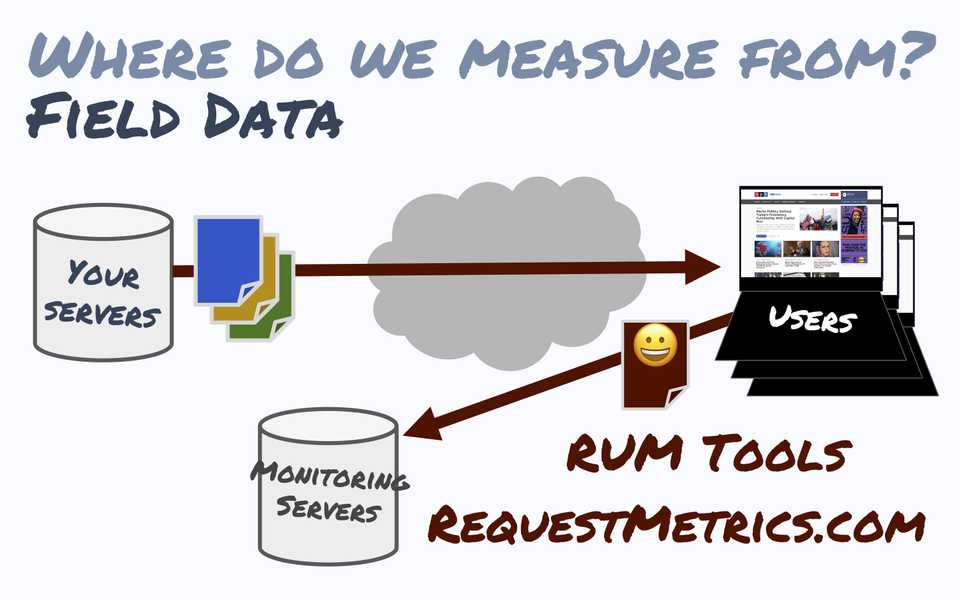
Field data describes how real users actually experienced your website. Field data is also known as Real User Monitoring (RUM), and is typically collected by monitoring real user experiences using JavaScript on the pages they load, and reporting various metrics to an analytics solution
Field data can be extensive and sometimes noisy, meaning it includes irrelevant information. To make sense of field data, you need to use statistical methods.
Interpreting Performance Data with Statistics
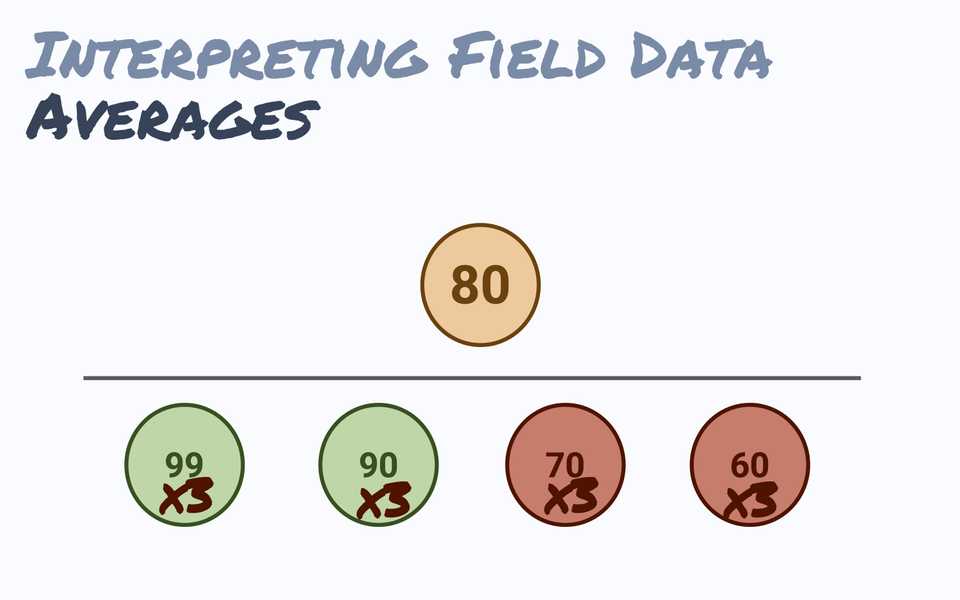
Averages are a simple way to understand data sets, but they can be misleading due to uneven performance distribution. For example, an average Lighthouse score of 80 could result from very different performance scenarios.
To get a clearer picture, use median and percentiles.
Median and Percentiles
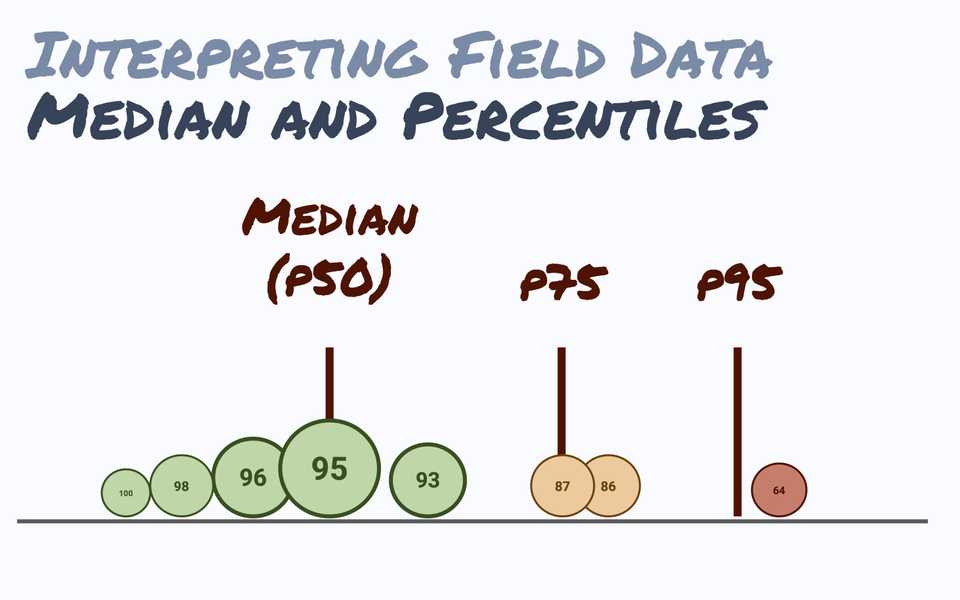
The median score is the middle value in a sorted list of performance scores, representing the typical user experience. Percentiles like p50, p75, and p95 show the performance for different segments of users:
- p50 (50th percentile): This is the median score, indicating that 50% of users have a performance score below this value and 50% have a score above it. It represents the “typical user” experience.
- p75 (75th percentile): This score indicates that 75% of users have a performance score below this value and 25% have a score above it. It represents the experience of “most users.”
- p95 (95th percentile): This score indicates that 95% of users have a performance score below this value and only 5% have a score above it. It represents the experience of the “worst users.”
Here’s a simple code example to calculate percentiles:
// Performance scores, sorted.
var lighthouseScores = [100, 100, 90, 90, 90, 80, 70, 70, 60, 50]

// Desired percentile to calculate.
var percentile = 0.75

// Find the index 75% into the array.
var idx = Math.round((lighthouseScores.length - 1) * percentile)

var p75Score = lighthouseScores[idx]
Tools to Measure Web Performance
Now that you understand the metrics and methods for measuring web performance, let’s look at the tools available to help you
Refer to Core Web Vitals workflows with Google tools
1. Lighthouse & PageSpeed Insights
Type: Synthetic Lab Data
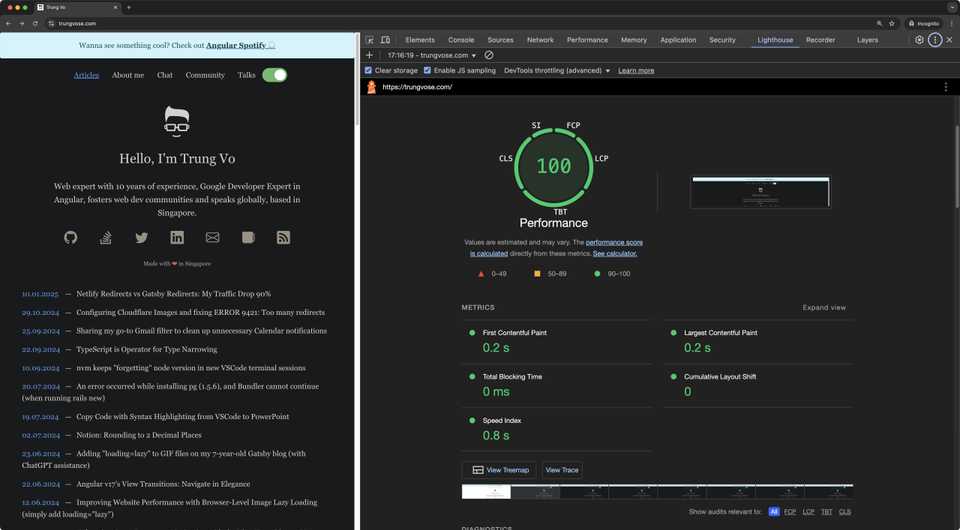
Lighthouse is an open-source tool from Google that can be run from Chrome DevTools or from the command line.
Lighthouse runs from you local computer, so it’s measuring the performance you experience with your hardware on your network.
Lighthouse-CI is a related tool that runs Lighthouse during project builds and deploys to assist with performance regression testing. It presents a Lighthouse report along with pull requests, and tracks performance metrics over time.
It generates an overall performance “score” to make you feel good (or bad) about your site’s speed. This score can be useful, but has some limitations.
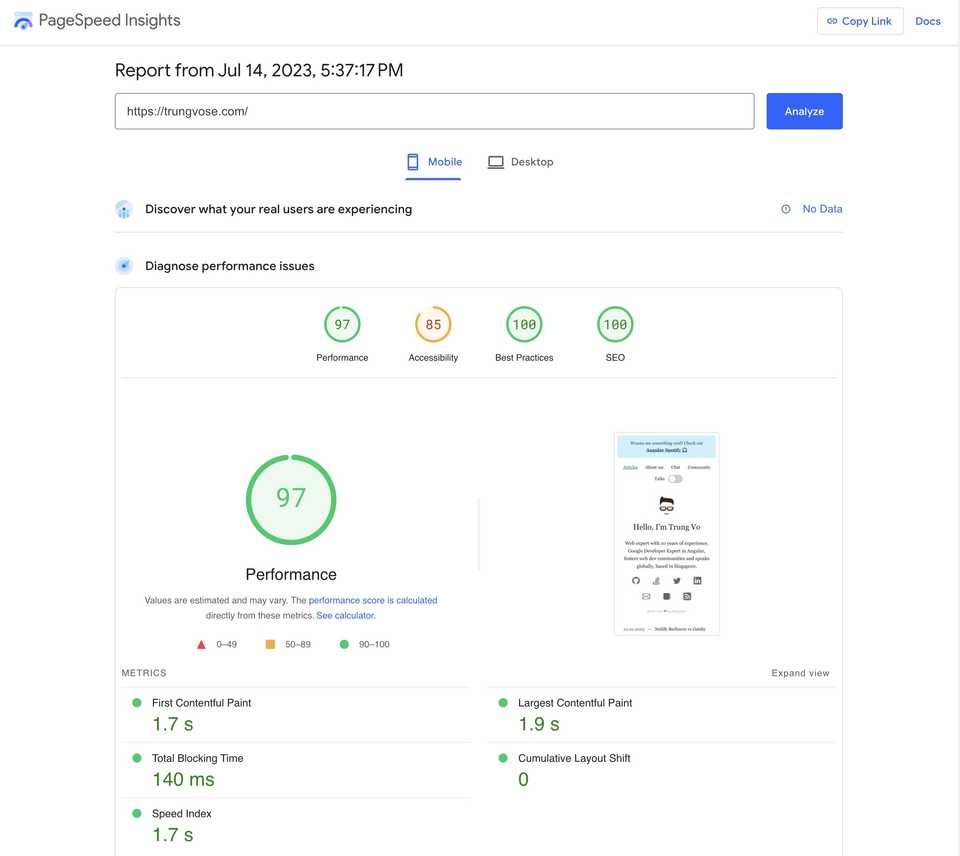
There are several places where you can run Lighthouse-as-a-Service from elsewhere on the internet, including Google’s PageSpeed Insights.
2. Chrome User Experience Report (CrUX)
Type: Field Data
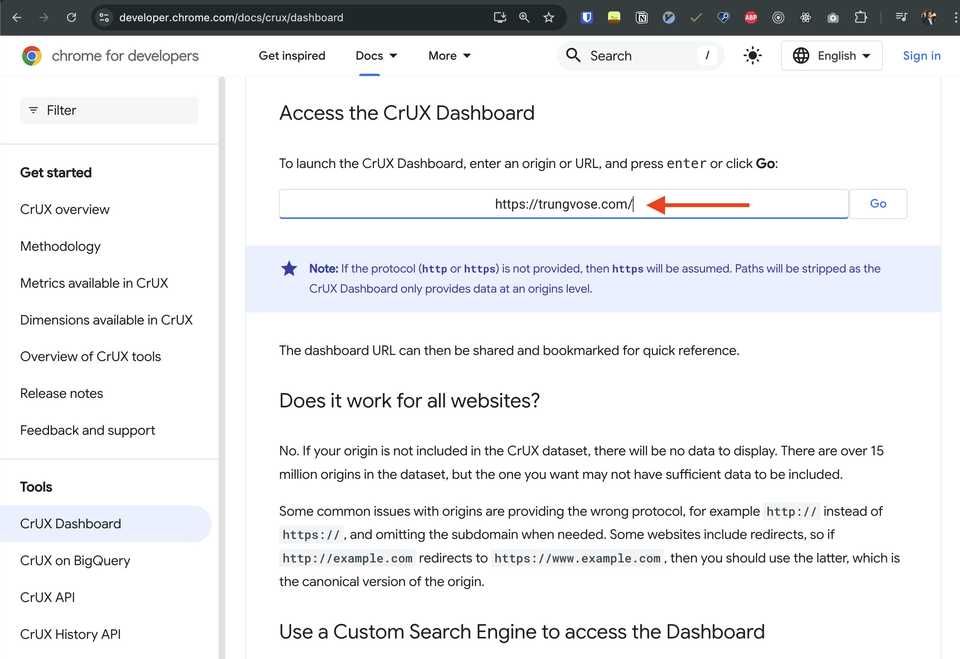
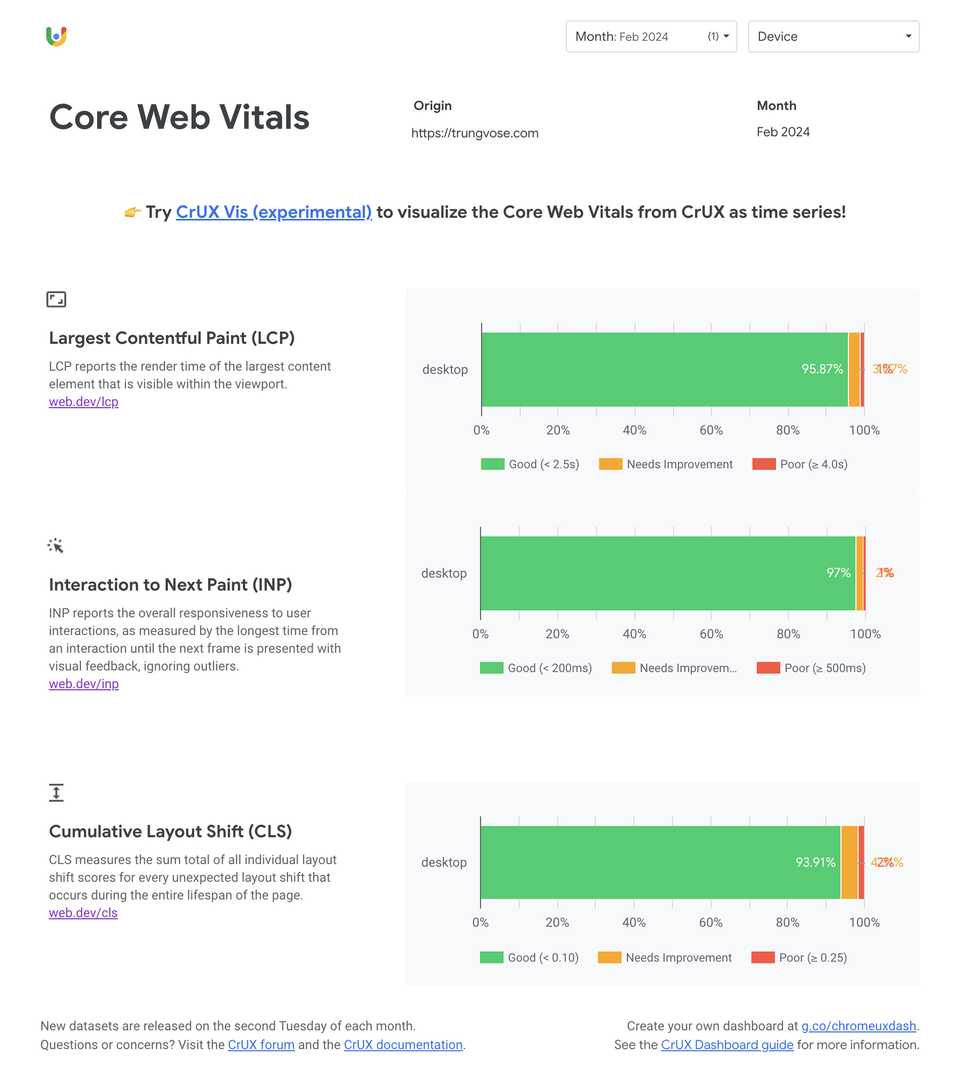
The Chrome browser itself collects performance metrics from opt-in users for the top million domains on the internet. Google publishes these metrics in the Chrome User Experience Report or CrUX. It’s real-user data!
- CrUX only represents Chrome users, and even then, only a subset of Chrome users
3. Google Search Console
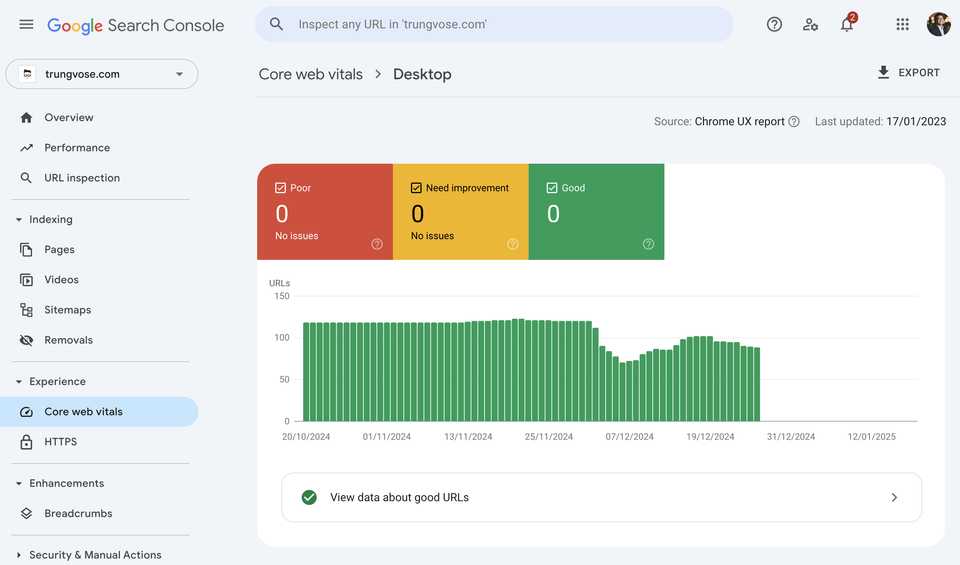
Google Search Console shows the analytics, issues, and performance recorded by the Googlebot crawler when Google indexes your website. This includes User Experience metrics like the Core Web Vitals.
Although the Search Console metrics are synthetic, they are what Google will use to rank your site in search results. They represent a very important user: Google.
The metrics you’ll see in Search Console will be quite slow to update, depending on the traffic to your website. It could be a week or more for Google to see changes in your performance scores, and the reports are very generic.
You need to use Search Console to see how Google ranks your performance, but it’s not very useful for testing or discovering performance issues.
4. Chrome DevTools (Update September 2024)
Type: Synthetic Lab Data (with some context from CrUX)
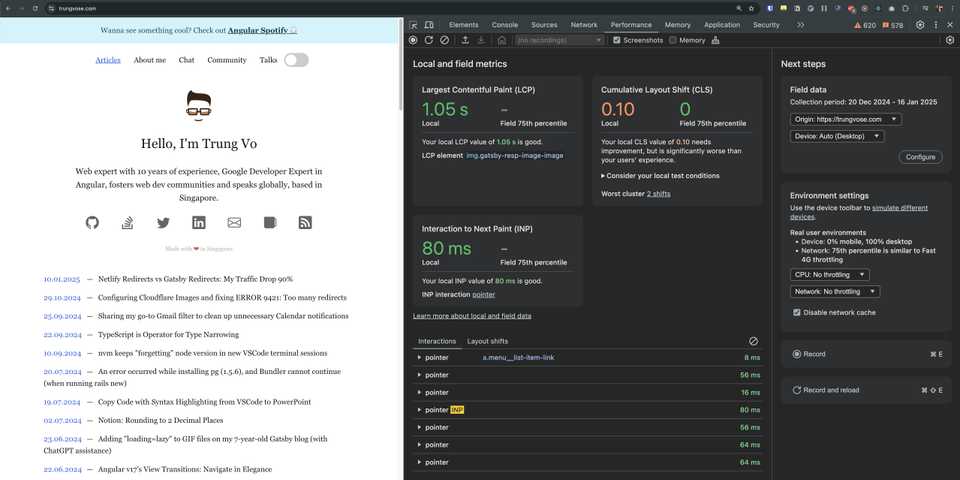
Chrome has so many amazing updates since the last time I wrote this article. The Chrome DevTools now has a new Performance panel that shows you the Core Web Vitals for your website.
When you open the Performance panel, it immediately captures and shows you your local Largest Contentful Paint (LCP) and Cumulative Layout Shift (CLS) metrics tells you their score (good, needs improvement, or bad).
The new Performance panel is pretty cool, thus I decided to write a new article Performance panel: Analyze your website’s performance about it. Stay tuned!
- The Performance panel is a developer tool that primarily provides lab data—though with some context from CrUX. It’s not a substitute for field data.
5. WebPageTest
Type: Synthetic Lab Data
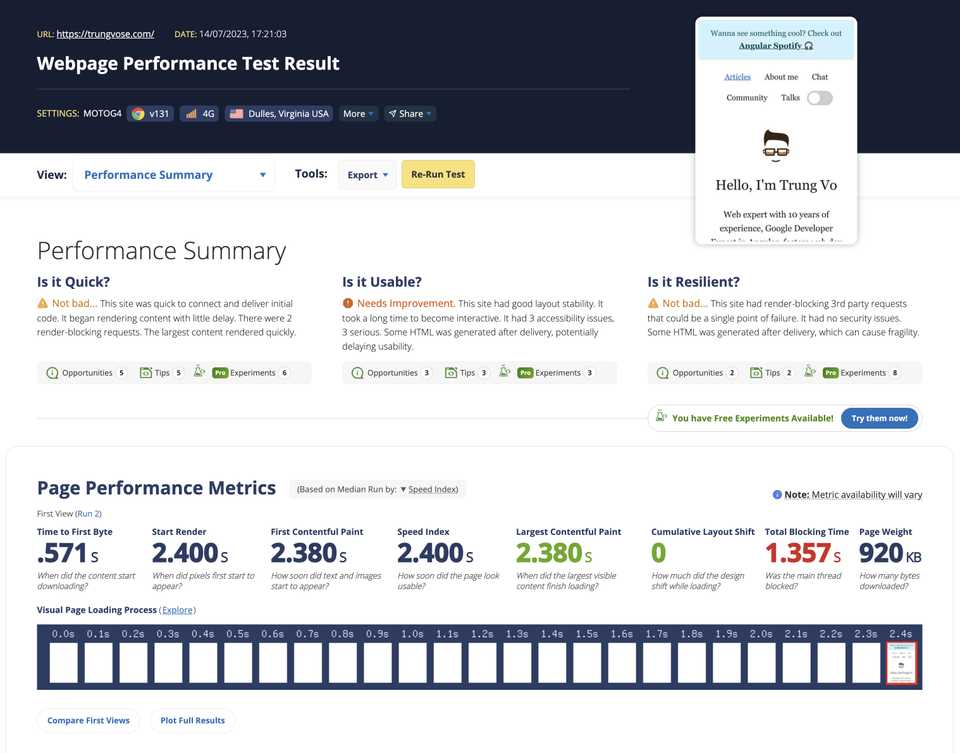
WebPageTest is a free hosted service that performs performance tests on public websites. It can do a lot more things than Lighthouse, like setting up network locations, network speeds, and customizing requests.
It also produces a more detailed (and more complex) report with network location, breakdown of timings, and a detailed waterfall chart.
WebPageTest is great for auditing live websites to better understand how they are performing in production.
Summary
Measuring web performance is essential for ensuring a fast and efficient user experience. By using tools like Lighthouse, WebPageTest, and Chrome DevTools, you can collect lab and field data to evaluate your website’s performance effectively.
